AI Infographic Generator — Turn Any Text or Report Into an Infographic
infographicAI reads your text, article, report, or raw data, finds the story inside it, and designs a matching infographic in one of 14 visual styles. Refine any version in plain language — no templates and no design tools required.
Your content has a story.
We know how to show it
It reads your content first — extracts the insight, finds the narrative, then matches it to a visual language that actually fits.
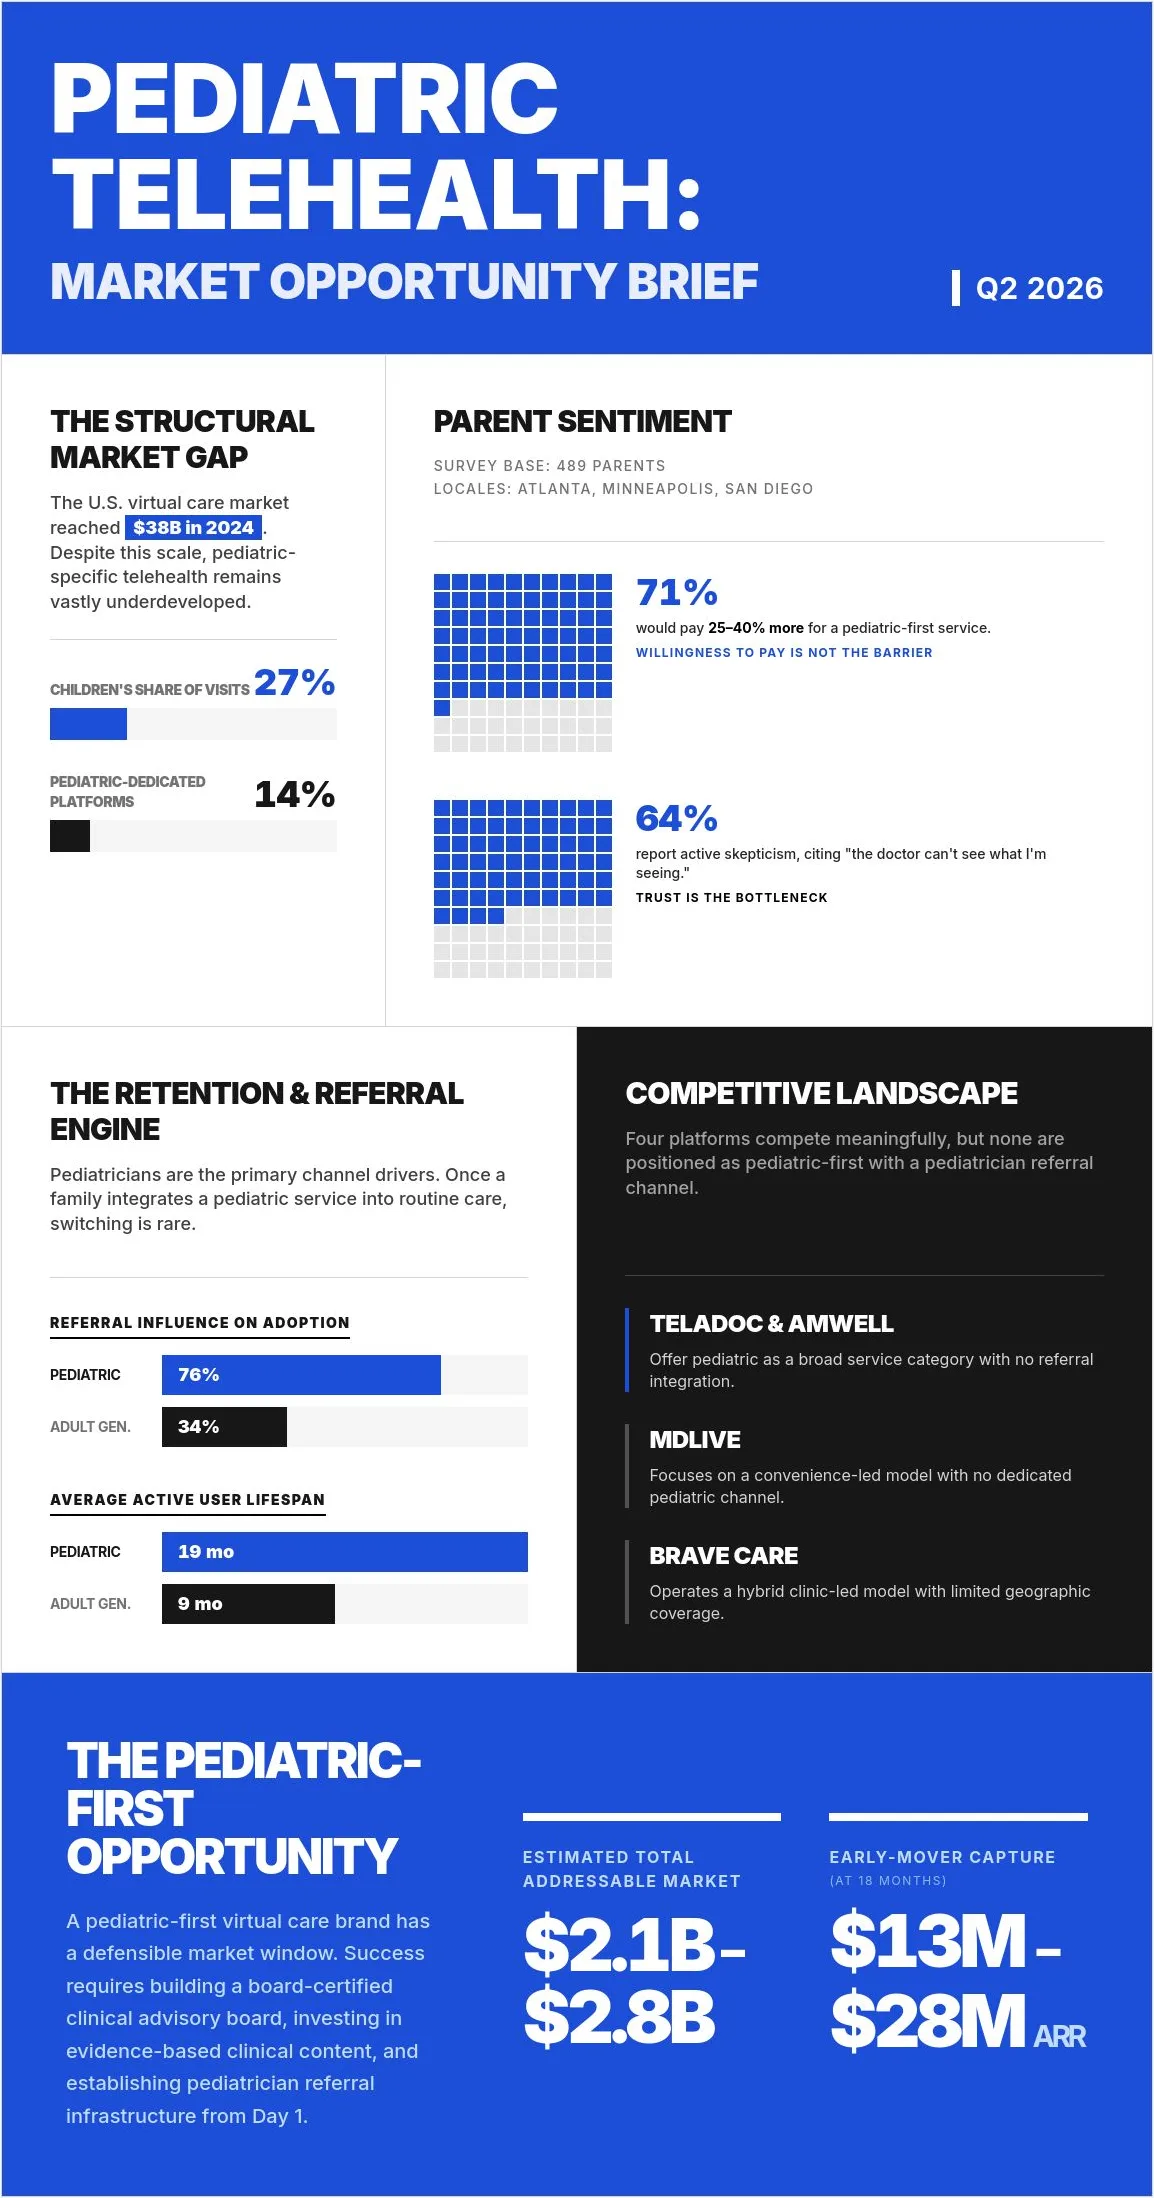
An analyst's market brief
Honored the structure.
Style: Clean & Corporate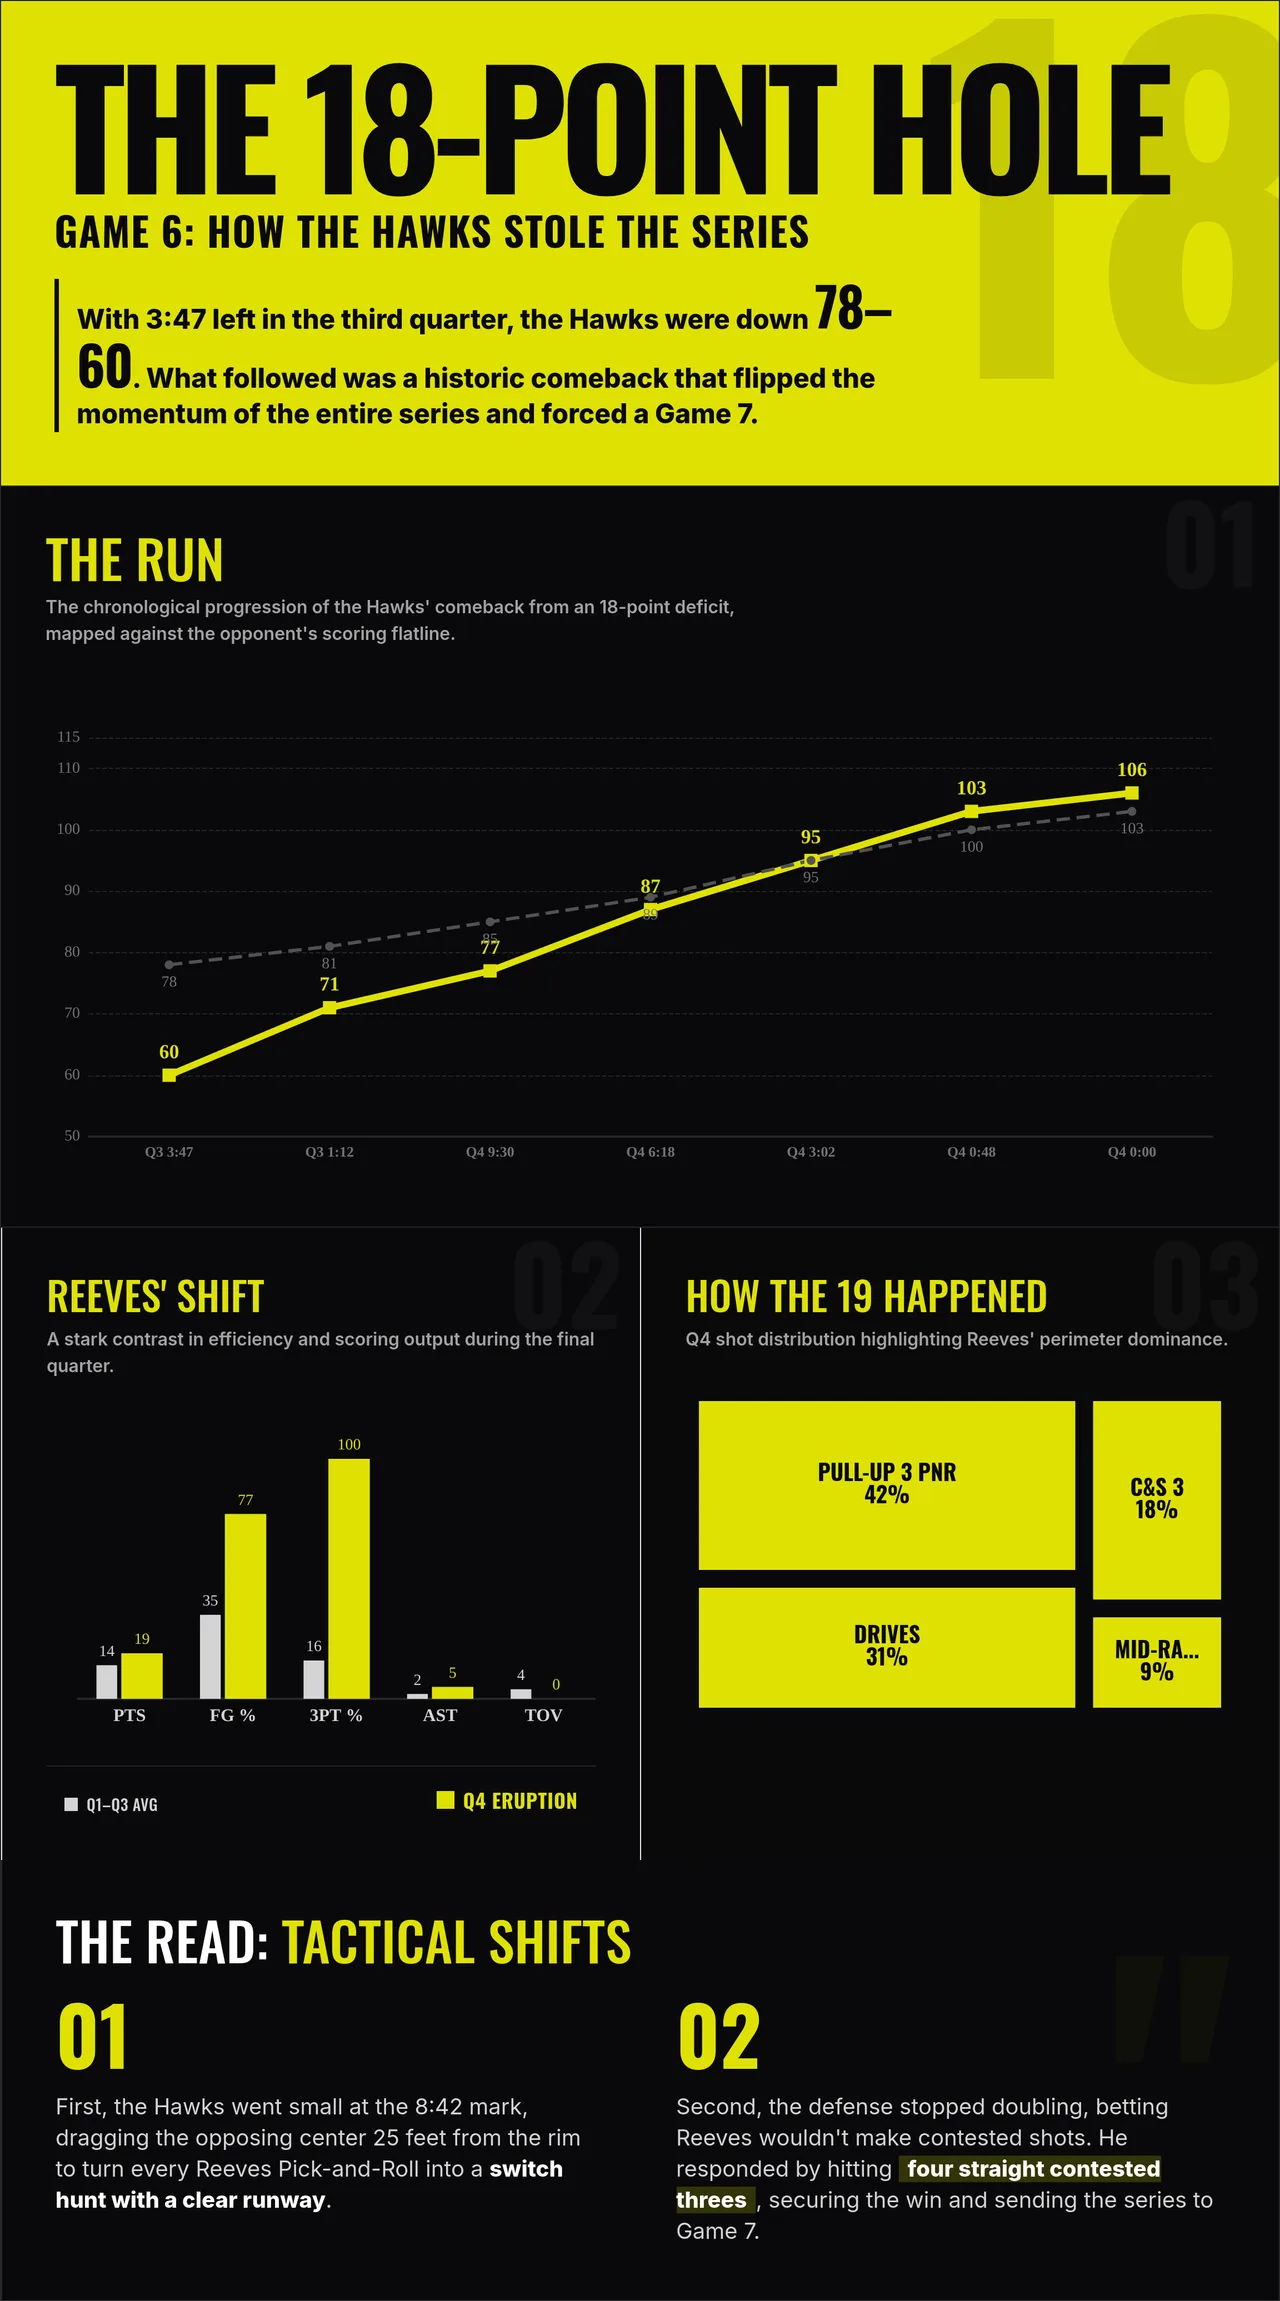
A Game 6 comeback breakdown
Carried the voice.
Style: Bold & Dynamic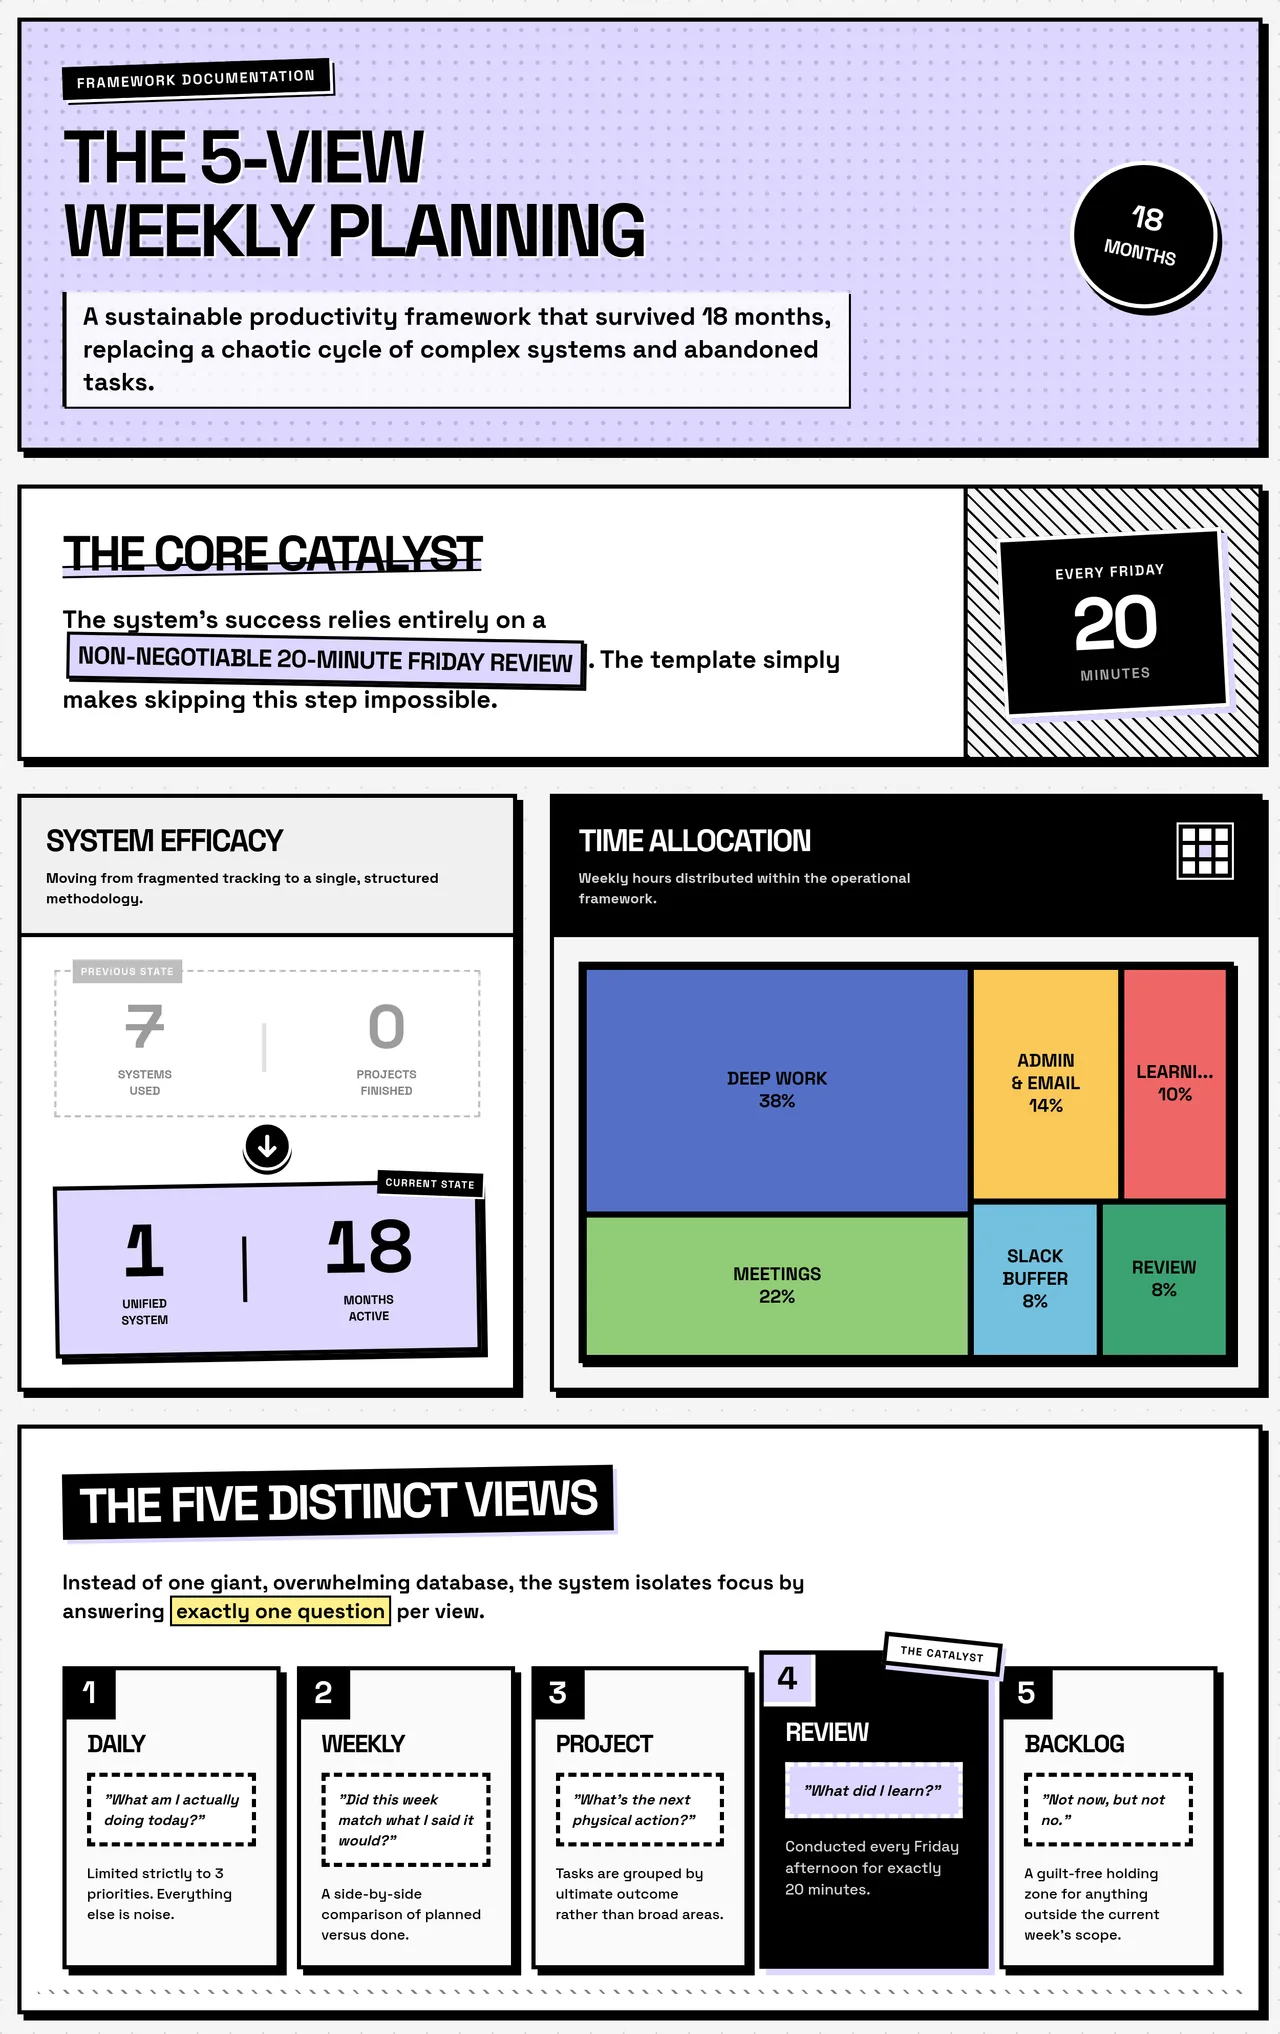
A weekly planning post-mortem
Surfaced the buried insight.
Style: Pastel PopUnder 3 minutes each.
How our AI infographic generator actually works
Paste, generate, refine, publish. Here's what happens at each step — and how each one shapes the final design.
AI reads between your lines
Paste your report, article, or post — whatever you've already written. Auto-Match reads it the way a designer would: looking for what the piece is actually trying to say, where the argument lives, which numbers matter most, and where the voice is. Because what comes next — the layout, the colors, the chart choices — only works if the reading is right.
Matched to your message, not a template
Based on what it reads, Auto-Match picks one of 14 visual styles — the layout, color palette, typography, and chart types together. An analyst's market brief gets a Swiss grid where structure carries the argument. A sportswriter's comeback story gets acid yellow on black, because numbers should shout. A personal post-mortem gets pastel blocks with heavy black borders, because the voice matters as much as the data. Every design decision is a content decision.
Say what you want changed. Done.
Your first version is ready — but you're not done. Type any change in plain language and Auto-Refine regenerates instantly. No design tools to learn, no menus to hunt through. Iterate until it's yours.
The process stays the same whether your input is 500 words or 2,000: paste, generate, refine, publish. The difference is what happens between paste and generate.