Example · Pastel Pop
A productivity system that survived 18 months — visualized
How a confessional productivity post became a single-scroll visual breakdown in one refine move. Real input, real conversation, real edits.
Note: This is an illustrative example. All input data and figures are fabricated for design demonstration.
PersonaProductivity writer · solo blogger|wants the post to land the real insight — that the system survived because of one specific Friday habit, not because of the template.
Input
“MY WEEKLY PLANNING SYSTEM. 18 months in. Still the only template I haven't abandoned. I used to have seven productivity systems and zero finished projects…”
infographicAI
Your infographic is ready. Tell me what to change.
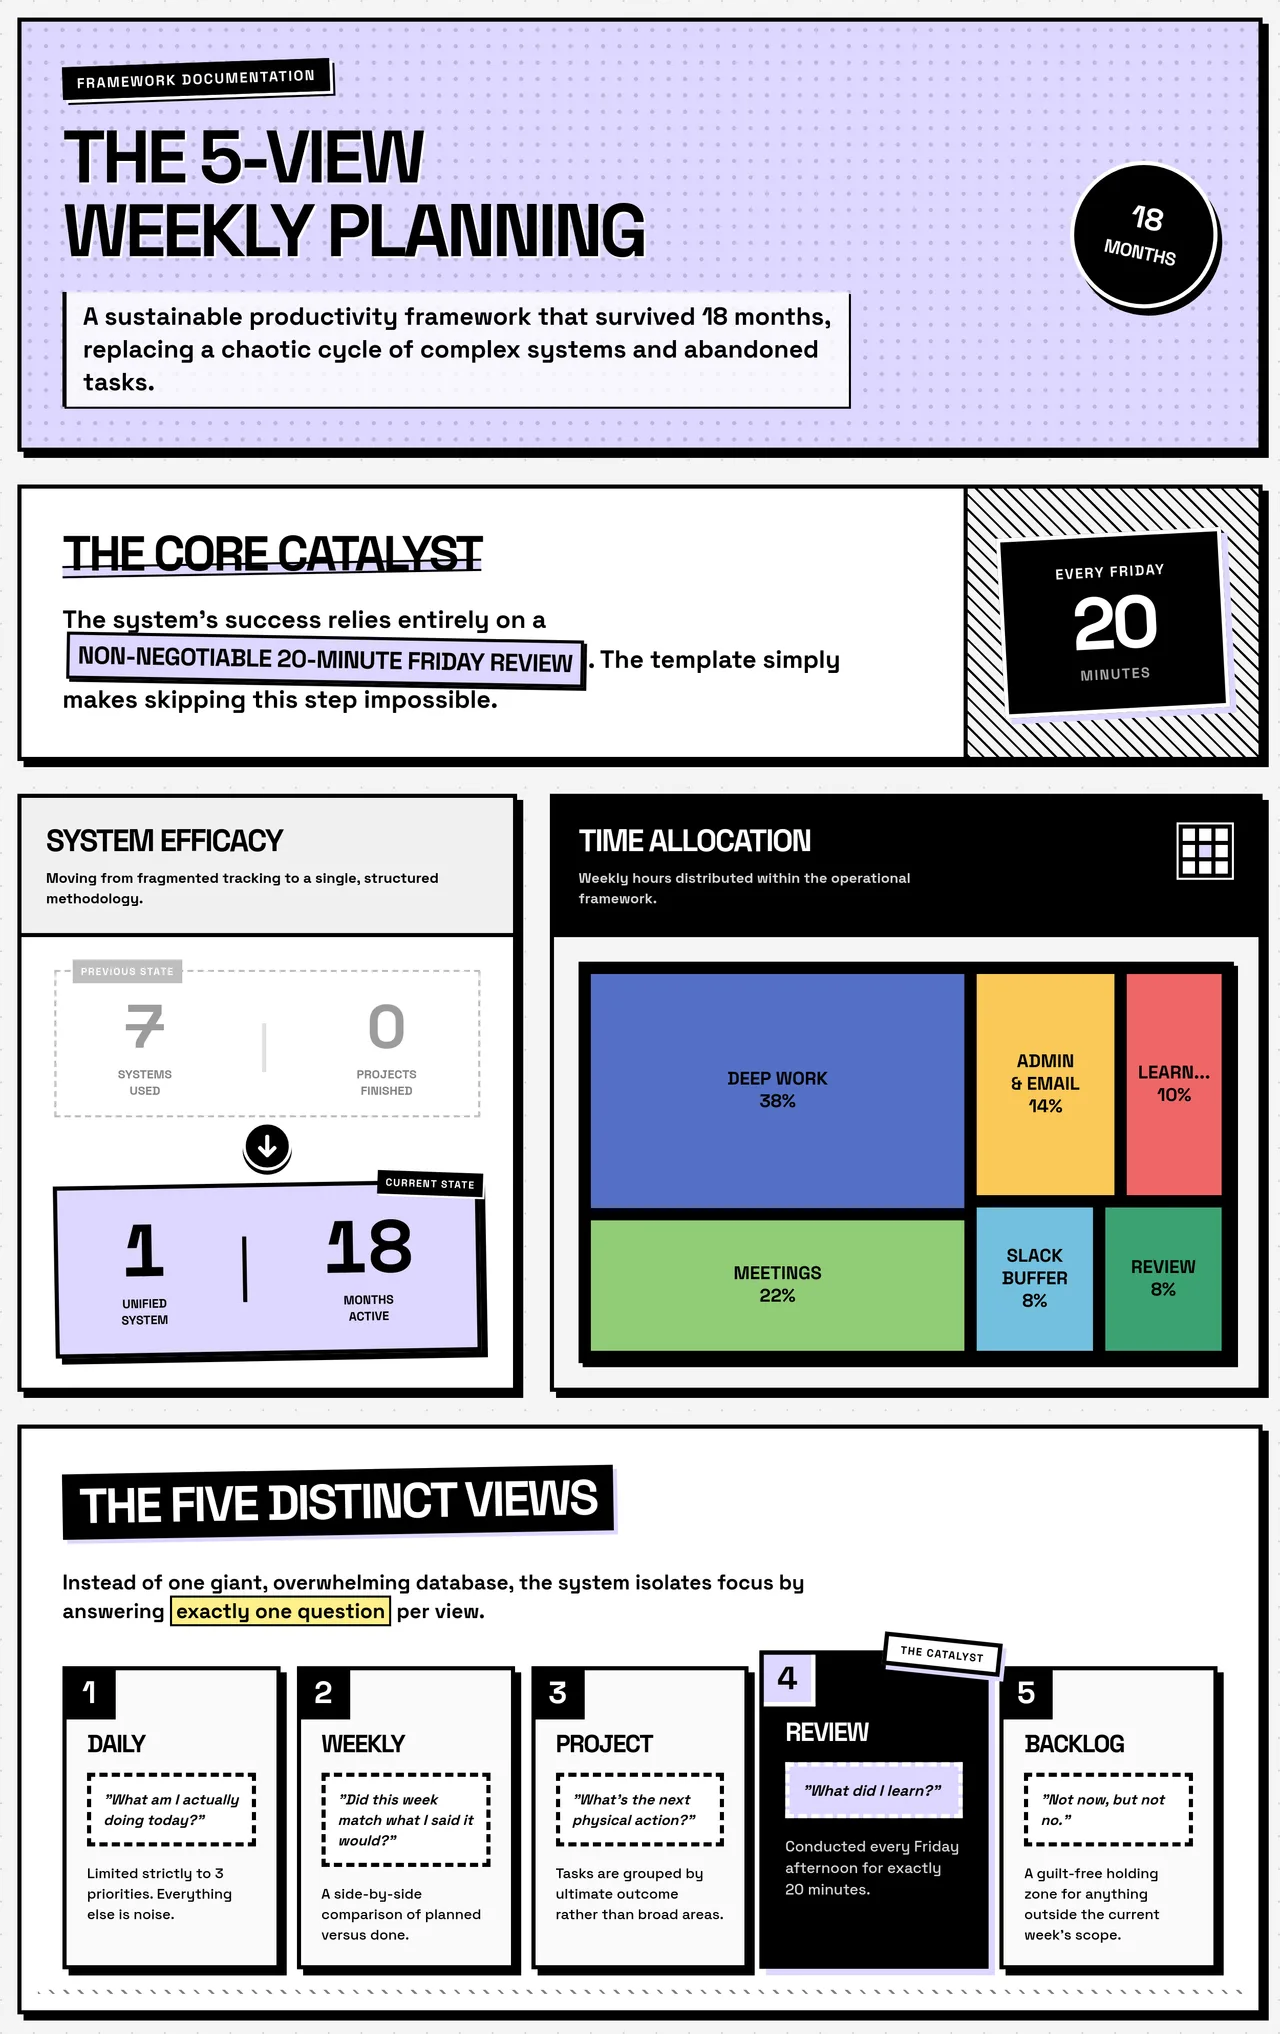
Refine 1
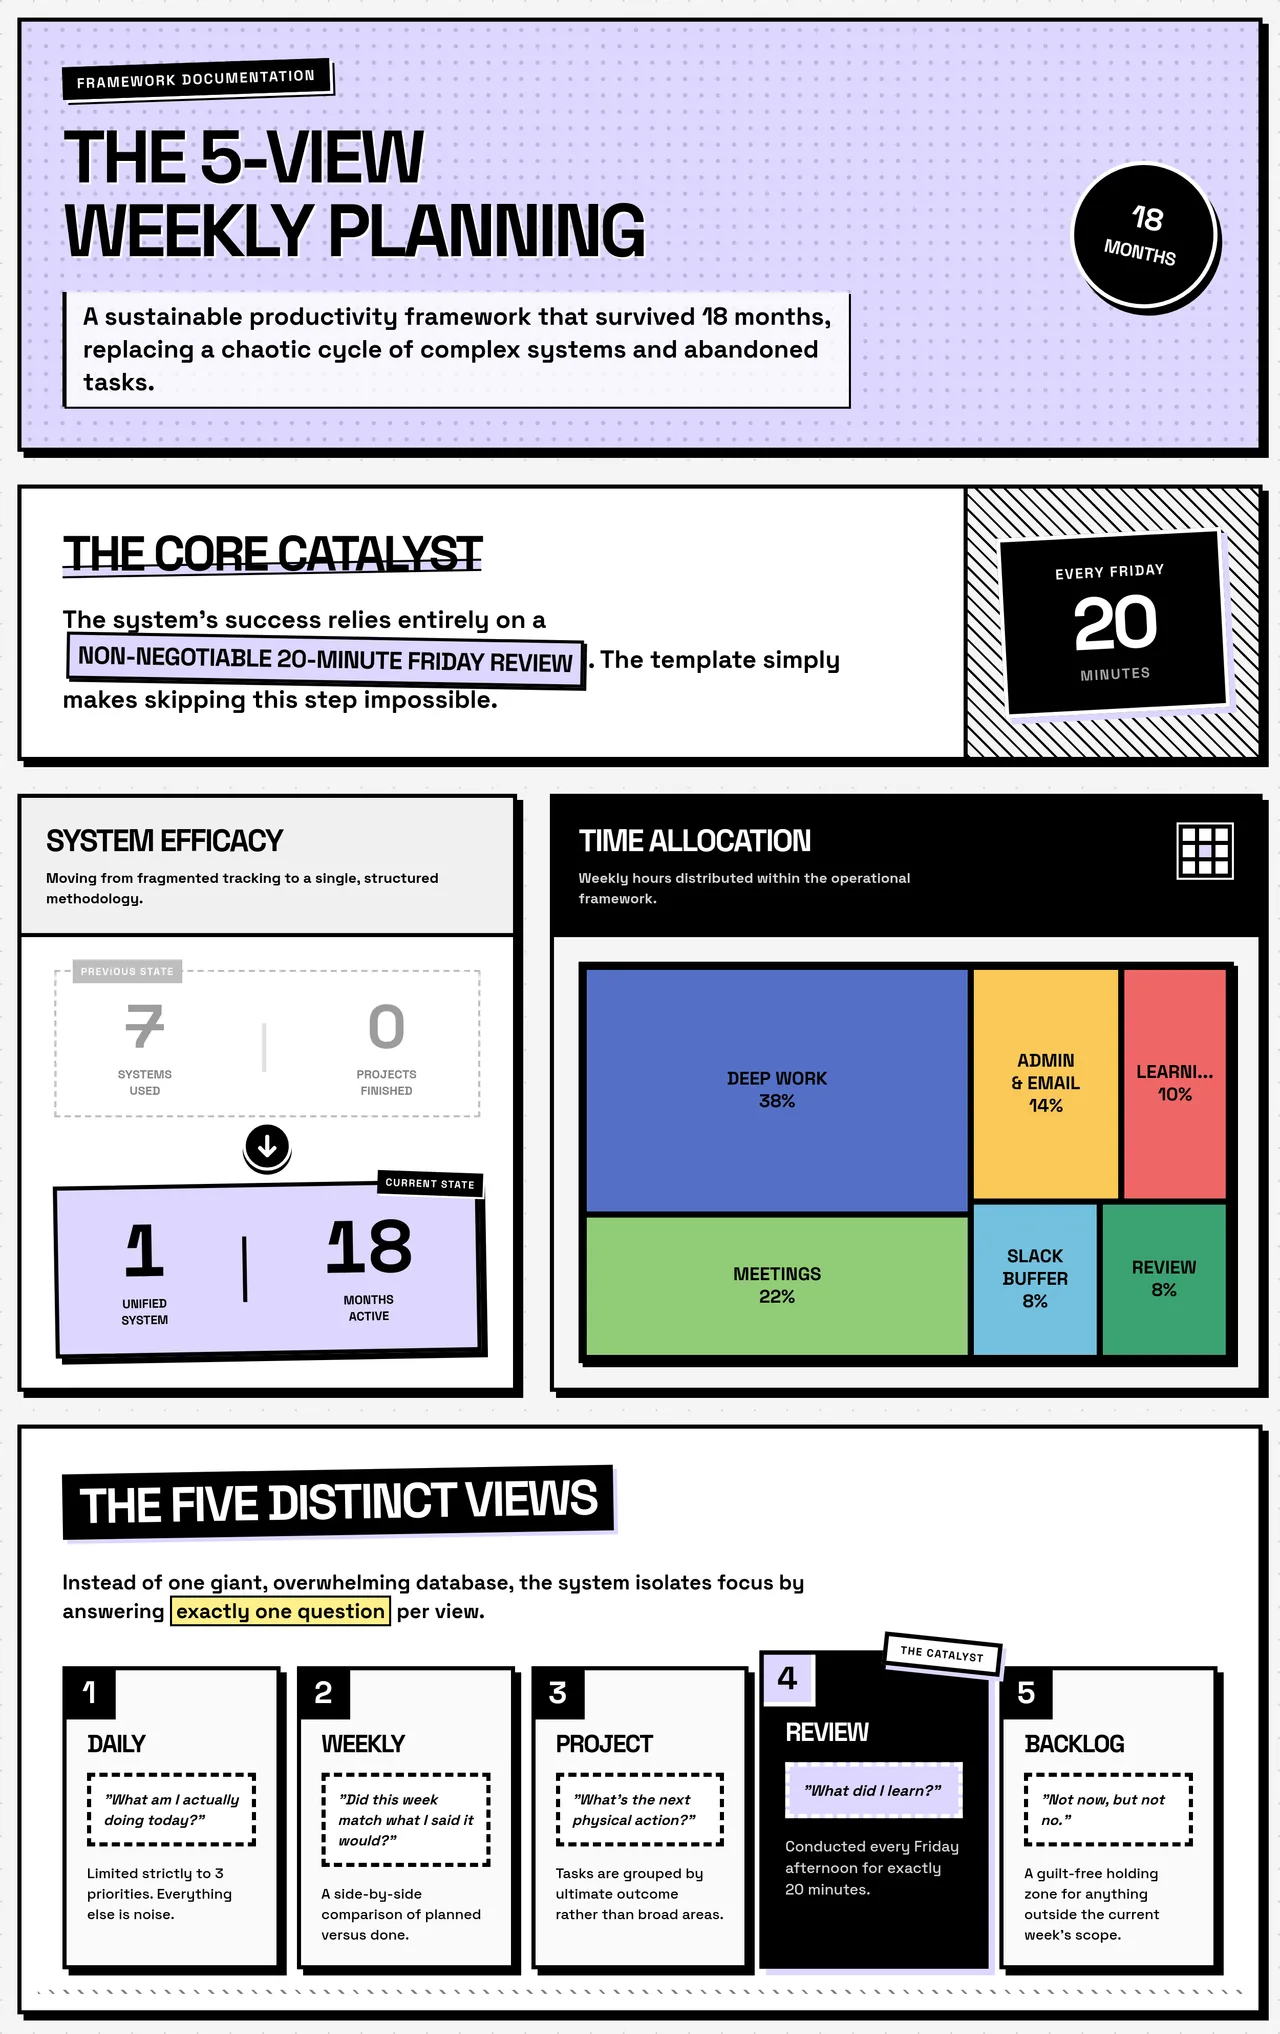
In the Time Allocation section, make the black borders on the treemap thinner.
infographicAI
New version generated.
Start with this post, in the same style
We'll prefill the input and pre-select Pastel Pop. Edit anything before you generate.
Try this exampleMore examples
All examples use illustrative figures for design demonstration.